ResearchCO₂ transfer
CO₂ transfer across the air–water interface
How fast CO₂ moves from air into water depends on what is dissolved in the water. I measure that rate in a sealed chamber as salt and surfactant are added, watch the CO₂ dissolve with laser-induced fluorescence, and model the uptake in a 2-D simulation. Salt slows the transfer a little; surfactant cuts it roughly in half.
- Status
- First-author manuscript in preparation
- Talks
- APS DFD 2024, Salt Lake City · APS March Meeting 2026
- Methods
- Closed-chamber gas transfer, PLIF, 2-D Navier–Stokes simulation
- Result
- kL from 7.2 cm/h (fresh water) down to 3.2 cm/h (salt with surfactant)
The question
The exchange of CO₂ between the atmosphere and lakes, rivers and the ocean is part of the global carbon cycle, and it feeds into climate models and estimates of ocean carbon uptake. Natural and polluted waters carry dissolved salt and surfactants. Salt changes the water's transport properties and how much CO₂ it can hold. Surfactants collect at the surface as a film that can get in the way of the exchange.
Most of the resistance to CO₂ transfer sits in a thin layer of water just below the surface, where CO₂ moves only by molecular diffusion. My dissertation measures how salt and surfactant change the rate across that layer.
The stagnant-film model
The stagnant-film model treats the air above the interface and the water below a thin film as well mixed. Inside the film, of thickness L, CO₂ moves by diffusion alone. The flux per unit area is set by a transfer velocity kL:
F = kL (Csurf − Cbulk), kL = D / L (laminar)
Csurf is the dissolved CO₂ concentration at the interface and Cbulk the concentration in the water below. Turbulence thins the film and raises kL. Beyond the laminar case, kL has to be measured, because it depends on turbulence, surfactants, bubbles, temperature, and the properties of the gas and water.
Experimental setup
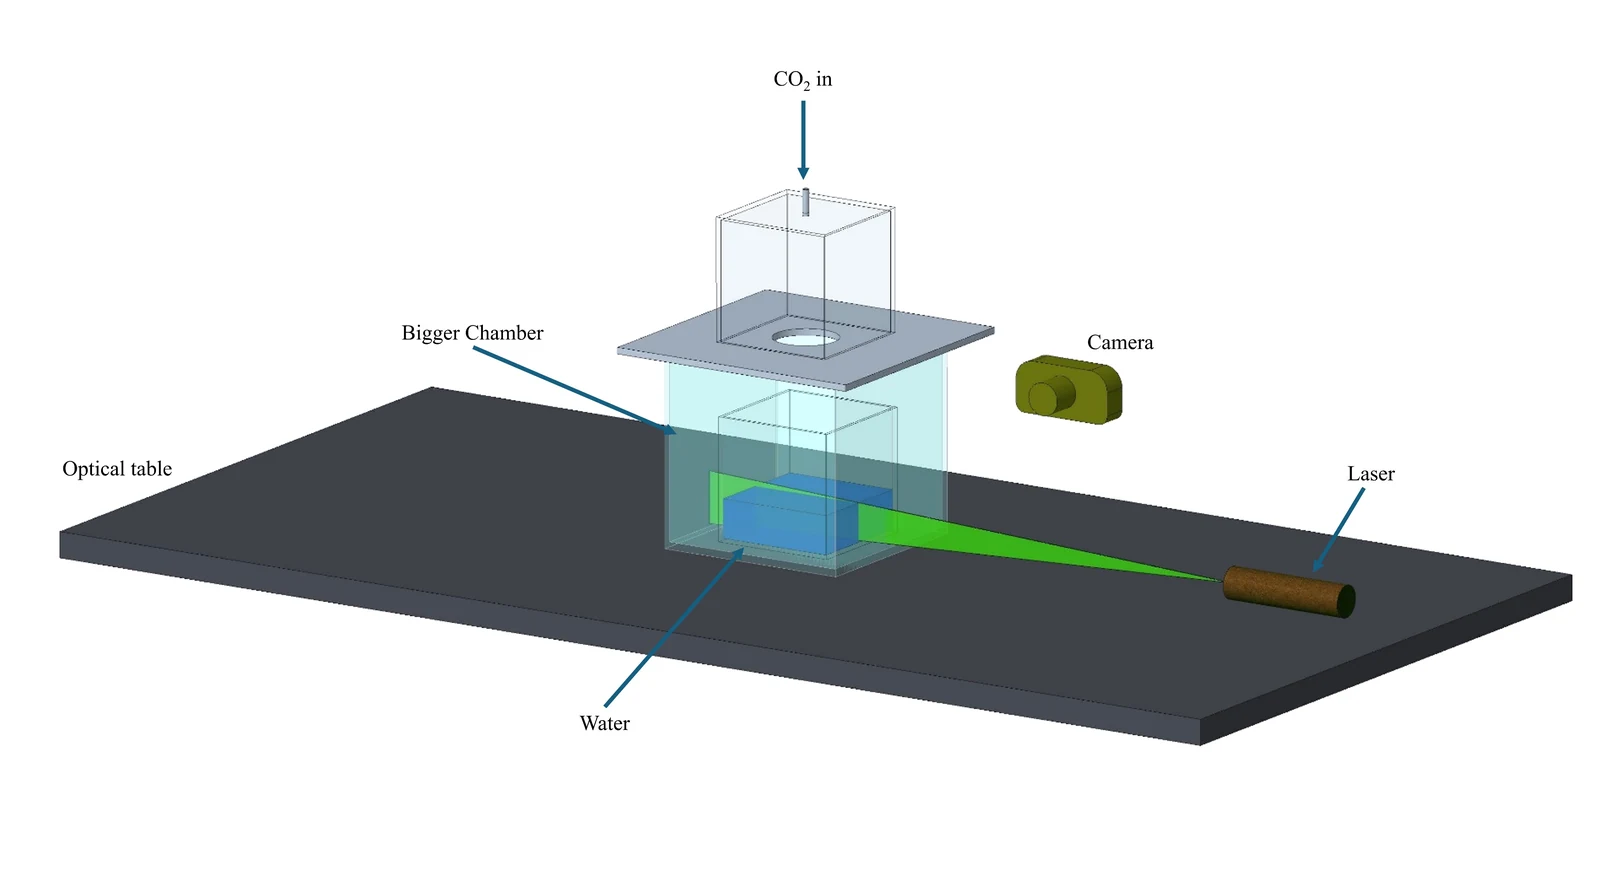
I use two setups. The first shows how CO₂ dissolves. A 10 cm water tank sits inside a larger sealed chamber, with CO₂ fed in from the top. The water carries uranine dye at 1.0 × 10⁻⁵ mol/L, a 532 nm laser sheet makes it fluoresce, and a Nikon V1 camera records the sheet from the side. Dissolved CO₂ lowers the pH, which dims the dye, so CO₂-rich water shows up dark. This planar laser-induced fluorescence (PLIF) is qualitative. It shows where the CO₂ goes but cannot give a transfer velocity.
The second setup measures the transfer velocity. A 15 cm tank, half filled with water, is sealed with a known amount of CO₂ in the air above it, at a partial pressure of no more than 1.5 kPa. A Vernier Go Direct CO₂ sensor tracks the CO₂ concentration in that air. A Corning magnetic stirrer turns a 2.5 cm magnet at 200 rpm in the water. Salt concentration ranges from 0 to 35 g/kg.
- ProgramMore than 500 experiments on CO₂, O₂ and air transfer into water, in sealed chambers of 3 to 4.5 L
- SolutesSalt up to 35 g/kg, sucrose up to 200 g/kg, surfactant up to 100 mg/kg
- MixingMagnetic stirrer in the water up to about 1,000 rpm; a fan in the air at five settings
- Result rangeTransfer velocities from 0.5 to 20 cm/h
The measurement is sensitive to the room. Temperature changes the solubility of CO₂, and humidity controls evaporation, which cools the surface and can drive a flow of its own. Each run starts with a stabilization dwell that holds the temperature within ±0.1 °C and the relative humidity at 95%.
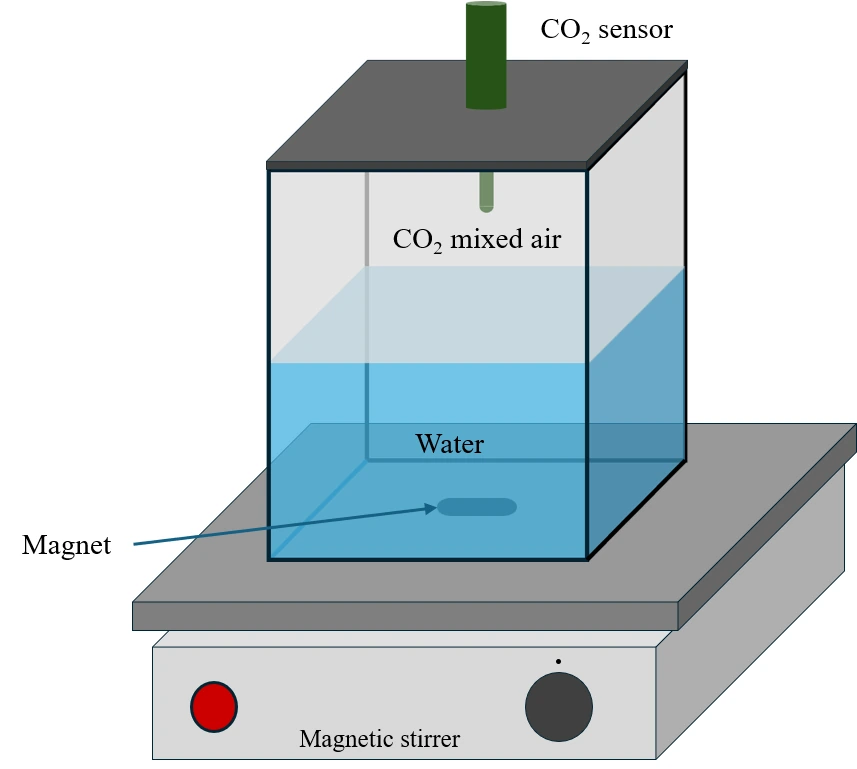
Because the chamber is sealed, every mole of CO₂ that leaves the air enters the water. With air volume Va, water volume Vw, interface area A and dimensionless solubility α, the CO₂ concentration in the air ca decays toward its equilibrium value c∞ = N / (αVw + Va), where N is the total CO₂ in the chamber. Integrating that decay between two times gives
kL = VaVwA(αVw + Va)(t2 − t1) ln ca1 − c∞ca2 − c∞
So the transfer velocity follows from the CO₂ concentration in the air alone, measured over time.
Seeing CO₂ dissolve
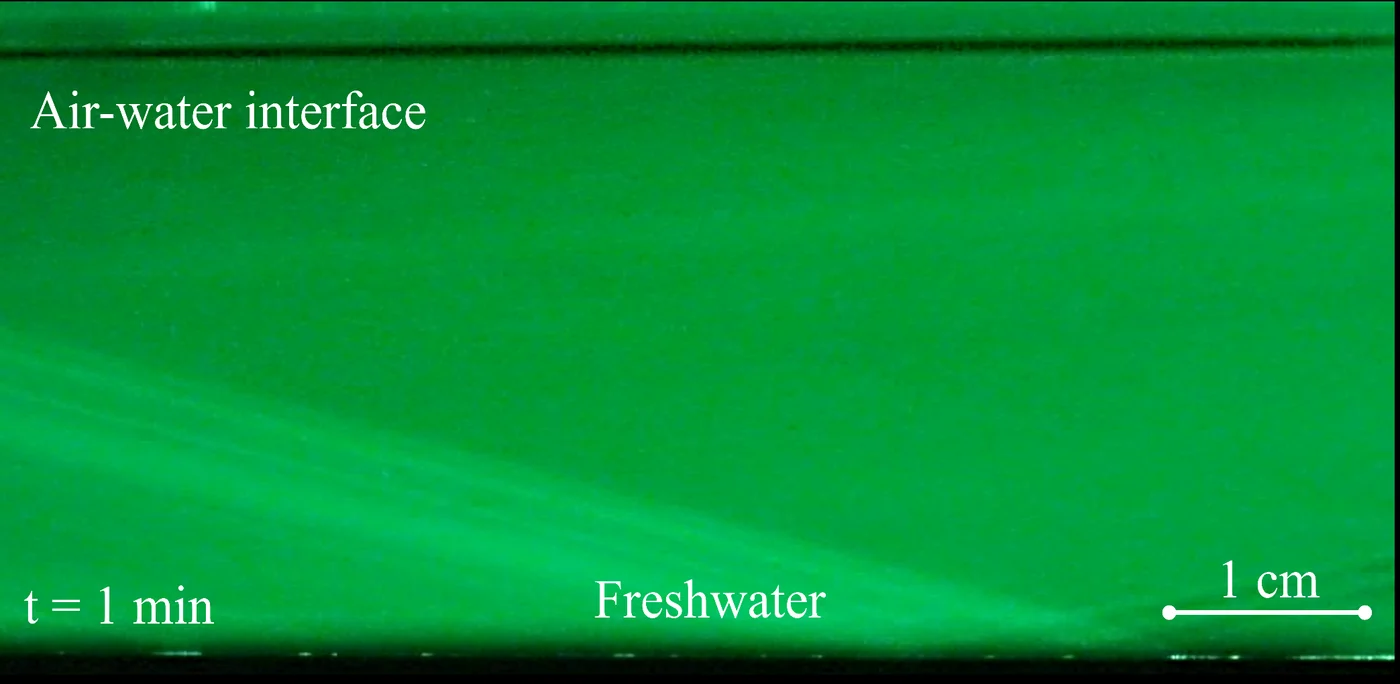
In fresh water, one minute after CO₂ enters the air, the water is still evenly bright and the CO₂ has only reached a thin layer at the interface. Ten minutes later, dark CO₂-rich water has spread well below the surface.
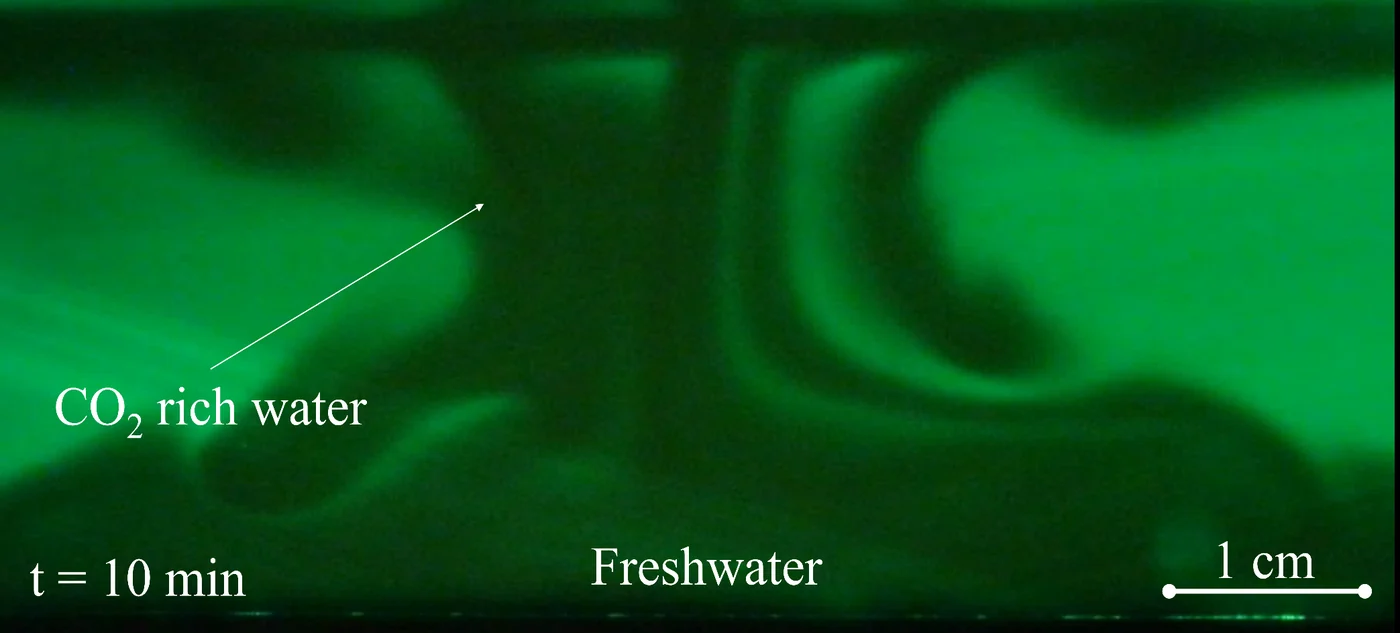
Recorded over a longer time, a plume of CO₂-rich water sinks from the surface with a strong downward flow and reaches the bottom of the tank.
Transfer velocities
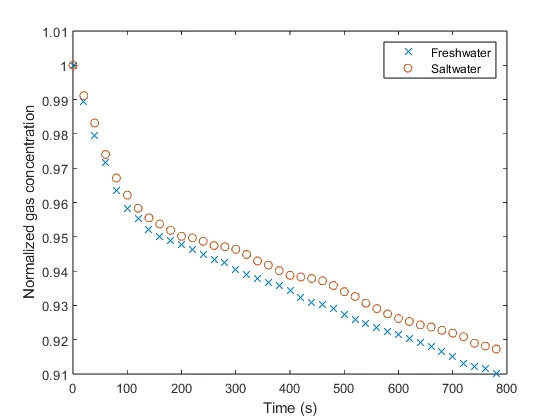
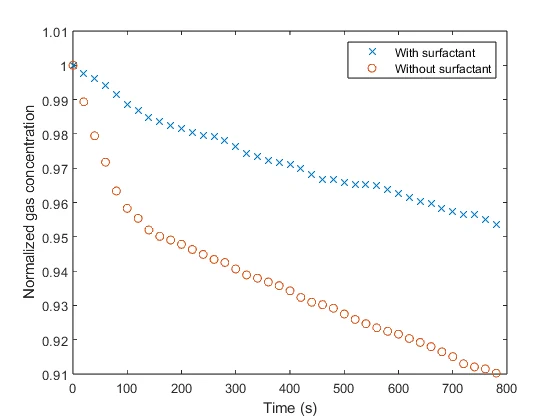
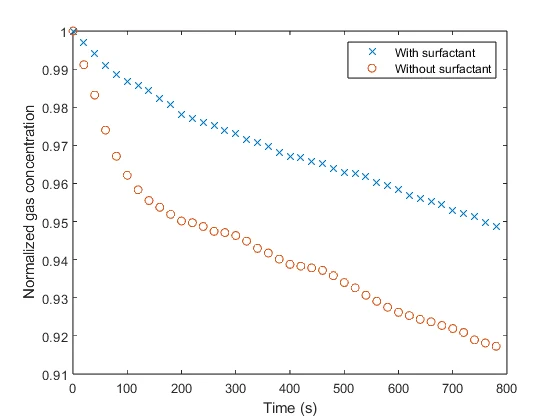
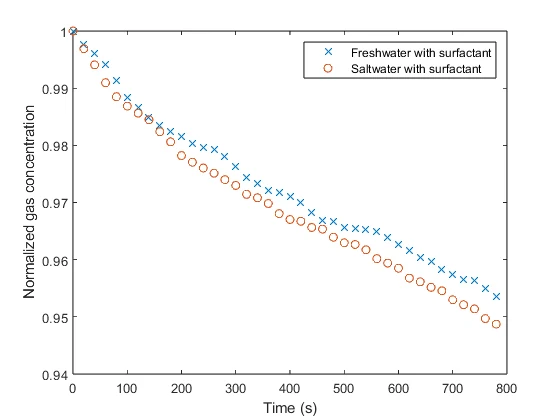
Each run starts with a fixed amount of CO₂ in the air and follows its concentration as the water absorbs it. The runs started at slightly different amounts, so each curve is normalized by its starting value. A faster drop means faster transfer into the water. These runs used the stirrer at 200 rpm.
- Salt
The transfer velocity drops from 7.2 cm/h in fresh water to 6.1 cm/h in saltwater, about 15% lower. Salt lowers both the solubility and the diffusivity of CO₂ in water, which may explain the drop.
- Surfactant
Surfactant roughly halves the transfer velocity, to 3.4 cm/h in fresh water. This is consistent with a surfactant film at the interface acting as a barrier.
- Both
Saltwater with surfactant has the lowest transfer velocity, 3.2 cm/h, slightly below fresh water with surfactant.
Surfactants from pollution could therefore slow how fast natural waters take up CO₂, with consequences for the carbon cycle.
Modeling the uptake
Alongside the experiments I built a 2-D simulation in MATLAB of CO₂ dissolving into still water beneath a closed headspace. Dissolved CO₂ makes water slightly denser, by only about 0.02 kg/m³ at saturation here. That is enough. The CO₂-rich layer at the surface grows heavier until it breaks into finger-like plumes that sink and carry CO₂ down far faster than diffusion can. The model shows the same kind of sinking plume that the PLIF video records in fresh water.
The model couples the incompressible Navier–Stokes equations, with the Boussinesq approximation for buoyancy, to CO₂ advection and diffusion in the water. A well-mixed mole balance tracks the headspace, and Henry's law links the two at the interface, so the gas side depletes as the water absorbs. A diffusion-only run, identical in every other way, is the reference.
- DomainVertical slice of the tank, 10 cm wide and 2 cm deep
- Gas sideClosed 0.8 L headspace, CO₂ at 6 kPa initially
- Grid360 × 180 staggered (MAC) cells, adaptive time step
- NumericsIncremental pressure-correction projection, van Leer TVD transport
- RayleighRa ≈ 8.5 × 10⁵ at the start
- ChecksMatches the analytical erfc solution to within 0.01%; CO₂ conserved to round-off
- Onset
For the first 12 minutes, CO₂ enters by diffusion alone and the two runs are indistinguishable. At about 12.5 minutes the surface layer goes unstable and the transfer velocity climbs above the diffusion-only value.
- Peak
Once the plumes form, the transfer velocity reaches up to 4.2 times the diffusion-only value.
- After 30 min
The water holds 1.7 times as much CO₂ as it would by diffusion alone.
Status
The manuscript, Gas transfer across the air–water interface and its dependence on dissolved solutes, is in preparation. I presented the work at the 2024 APS Division of Fluid Dynamics meeting and at the APS March Meeting 2026, with K. Jawney, I. Benouaguef, I. S. Fischer and P. Singh.
This work builds on our study of Marangoni flow induced by a raindrop, where the same salt and surfactant effects set the direction of the surface flow.